
Statistics are important if you want to know more about a certain cryptocurrency. So join us in our little stats reading guide. Take a look at transactions number, circulation supply and an average block size charts on the example of FuturoCoin!
Let’s get started – we will show you how easy the basics of statistical analysis can be.
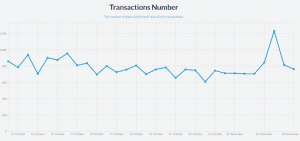
Here we have FuturoCoin’s total transactions number for the last month. FTO is a stable coin (not to confuse with stablecoin), which means the number of statistics doesn’t change much day by day. As you can see, every day the average transaction number oscillates around 800. Also, take a look at the number of transactions for 6th November. It went up to 1,231. Why? Maybe FTO just became a little bit more popular in the online space after we started our competition the day before that.
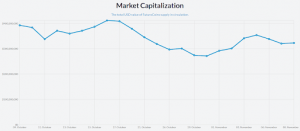
Next, we have the market capitalization (the total number of coins in circulation multiplied by the current coin price). It’s a lot more fluid chart. That’s understandable. Market value doesn’t change so quickly, that is why the statistics don’t experience any rapid increases or drops. The market capitalization stands daily at around 300,000,000 USD.
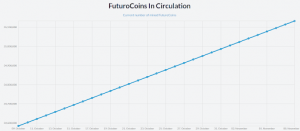
Another chart looks very boring, but it actually provides very important information about FuturoCoin. The maximum supply of FuturoCoin has been set at 100 000 000 FTO. The blocks time is around 1 minute, so the mining will take around 10 years. This chart means that FuturoCoin’s supply is continuously increasing!
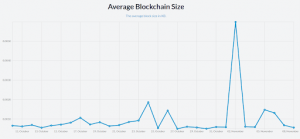
And now the last chart. We can see that normally, the average block size is of maximum 0.0019 kb. But once the block size boosted to impressive 0.0060 kb. The block size depends on the number of transactions put into it. The blocks can be filled up 0 to the set limit.
Be up-to-date with our most recent news and posts! https://medium.com/@FuturoCoin